dTON Kubernetes High Availability Transition, part 1
During the last year all dTON services were running on kubernetes cluster without HA build. Sometimes when we lost servers, we faced complex problems.
To improve the stability and availability of the service, we developed a high availability dTON cluster that will continue to work even if some of the servers are unavailable. Additionally, we've got setup complex monitoring and alerting system on services and data consistency.
Today we managed to switch all our services to HA cluster.
In this article, we want to share our experience of HA cluster on top of bare-metal servers in three parts:
- dTON Kubernetes High Availability Transition
- dTON LiteServers High Availability Transition
- dTON GraphQL High Availability Transition
Second and third part will be posted exclusively on @dtontech with promo codes on dTON API usage.
Kubernetes HA
The first thing we did was to configure kubernetes HA. Following the documentation in the staked etcd topology.
Hetzner Load Balancer checks the liveness of kubernetes API nodes and balances traffic between live servers.
This is one of the simplest and most important steps, because if you don't run kubernetes in HA mode, if a control-plane node crashes, the whole cluster falls apart, causing all services that communicate on the kubernetes network to crash.
Also, if you set up kubernetes initially not in HA mode - you can't upgrade it to HA without downtime.
In HA mode, you are limited only by the number of control-plane nodes behind the load-balancer. In our case it is 3 nodes and in case any of them crashing we can quickly add more control-plane nodes, which will allow our cluster to function in case of problems in datacenters.
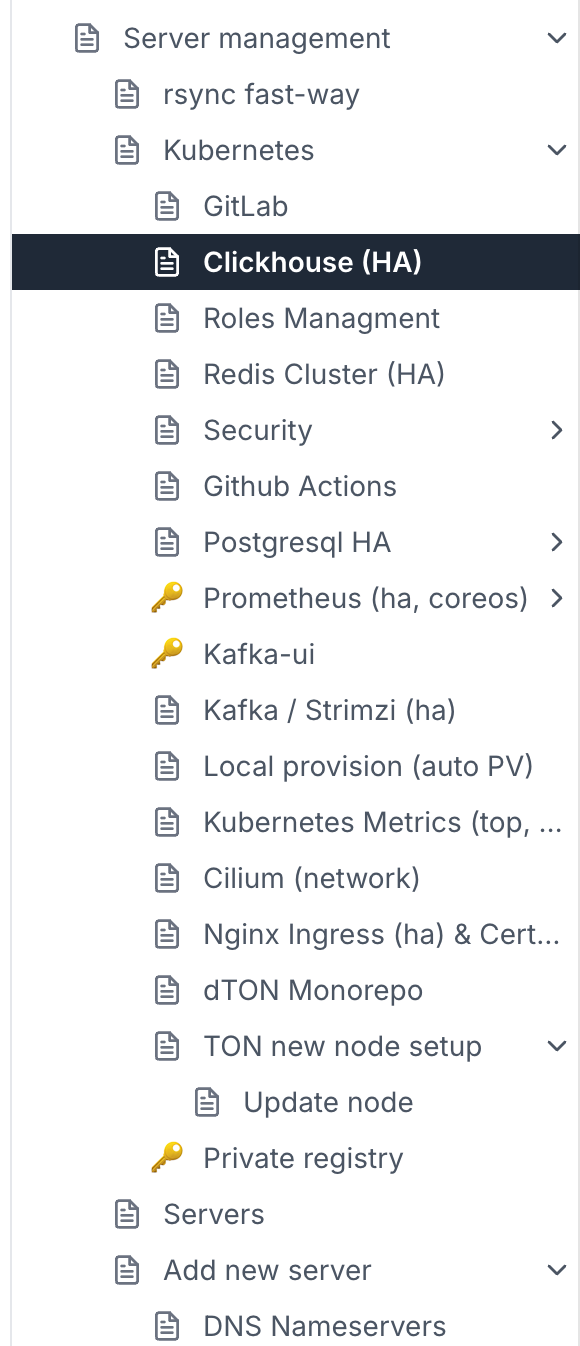
dTON Architecture
In order to pick the right HA infrastructure, let's break down the key components of dTON on which our TON index runs:
- Custom TON nodes - patched nodes with a lot of changes, including sending parsed blocks into kafka.
- Kafka - collects information from liteservers, lite-balancers, TON nodes and sends to other services
- C++ / Python parsers and emulator services - for each shard we raise its own service that indexes and emulates all network transactions and stores them in Clickhouse / Postgresql / Redis
- Python API server - convert GraphQL & Rest requests to databases 😄
- Clickhouse - the main database for transactions and blocks, currently the archive index size is 10tb
- Postgresql - a top-level database that contains metrics and small tables for quick access to data
- Redis - allows you to quickly give account states to index the following blocks and event traces
In addition to this, the following components are worth highlighting:
- LiteServer balancers - for HA access to live TON liteservers
- Github actions workers - for our custom libraries builds

- Prometheus & Alertmanager - for metric collection, status page and alerts to lovely Telegram chats
- Grafana
- Private docker registry
- Airflow
- Nginx Ingress
- Gitlab
We also have a number of our components for providing different services, but we will tell you about them sometime later.
Nginx Ingress HA
The first component of the system through which everything will work is nginx-ingress. It allows distributing the load among servers, automatically receive and renew HTTPS certificates and so on.
Naturally, this component should work behind a third-party load-balancer that will monitor liveness and do failover, so that traffic always gets only to live nodes.
We have created some nginx-ingress controllers according to the documentation and hid them behind Cloudflare load-balancer, which implements everything you need to ensure that your service always remains available.
Django
Before the upgrade, we were using gunicorn with Django processes. This consumed a lot of RAM as GraphQL queries were running for up to 15–20 seconds, so we needed to keep a lot of processes running.
We rewrote all API methods to async libraries and achieved faster responses, as well as reduced RAM consumption by 60%.
Docker Registry HA
Setting up a private docker registry turned out to be a bit more complicated. The point is that in most approaches, docker-registry relies on PersistVolume in s3 or other cloud providers. That makes it possible to run it on different servers with binding to one drive. For us, this solution is not suitable because we have bare-metal servers and PersistVolume is bound to a specific server.
And registry must be in HA build, because if it is unavailable - kubernetes pod will not be able to start, because it will not be able to check image hashes or download new ones.
To solve this problem, we have set up 3 different docker registries
first.private_registry.svc.cluster.localsecond.private_registry.svc.cluster.localthird.private_registry.svc.cluster.local
And when building the docker image, we upload the image into all three docker-registry.
At the same time all images are downloaded from private_registry.svc.cluster.local which automatically failover at Nginx Ingress rules level
So even if some server with docker-registry is unavailable - the cluster will live and download images from HA registry.
Prometheus
Also, a very important part for HA cluster. The thing is that prometheus not only collects important metrics, but also has notification rules. If something goes wrong, it will report it. In our case, to our Telegram chats. Even if some servers are down.
We lifted kube-prometheus-stack into 3 replicas for prometheus & alertmanager.
For our status page we rewrite API to prometheus so you can publicly see status on our status page:
TON Nodes
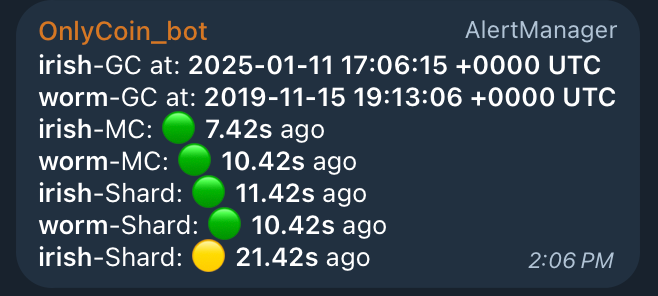
The main change we made to TON Nodes due to this HA transition is adding Prometheus exporter / liveness http endpoint directly to the process of node.

This allowed you to set up AlertManager with the status of nodes directly in Telegram:
- Garbage collection - since what date the node has been storing data
- MC block - when the last Master Chain block was seen in the node
- Shard Block - when the last Shard block was seen in the node
It also allowed to monitor the load on liteservers, td::Actor, etc. in Grafana and store this data for a week to analyze problematic situations.
Liveness probe is also a very important component - it allowed to configure kubernetes probe directly to the node process and if there are any problems with TON node - it is automatically rebooted.
Kafka
Kafka is difficult to set up. We used strimzi + kafka-ui + kafka-lag-exporter.
Strimzi includes cruise-control, zookeeper, kafka-exporter
The thing is, if some server with kafka goes down - kafka needs to rebalance topics with cruise-control, in order to keep them up-to-date. Without cruise-control there is no way to maintain HA kafka.
Also Strimzi works on the kubernetes-operator concept and is pretty easy to configure and manage topics.
From some of the customization changes, we have added:
jvmOptionssocket.request.max.bytes/replica.fetch.max.bytes
For each topic:
retention.ms/retention.bytes/max.message.bytes
Since TON creates quite a heavy load at peak and blocks weigh a lot, it is important that Kafka does not lose any messages and allows large blocks & transactions to pass through. And the pods themselves were configured correctly in terms of resources (pod resources & jvmOptions) to handle large messages correctly.
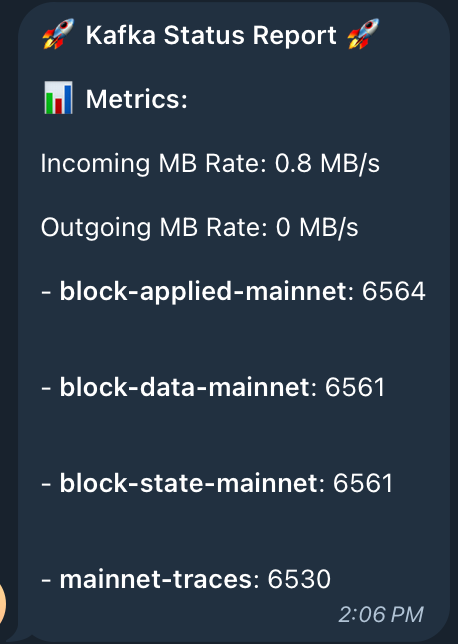
And of course, we configured fancy status in telegram via Prometheus & alert manager:
Redis HA
For redis we chose the light method - 1 write point & several replicas in conjunction with Sentinel to select the actual master.

We also:
- updated the code of all index workers to work with Sentinel.
- configured backups and Prometheus metrics & Grafana dashboards for monitoring.
Redis is one of the critical components for the index, in case of data loss it can take up to 10 minutes for the index to be down.
Data from Redis is needed to properly handle the emulation and population of network accounts, depending on their type and past data. For example, event traces or diff balances, confirm NFT & Jettons by Collections and Minters for correlated blocks and so on.
Postgres HA
We used crunchy postgres operator to create master/replica and backups. Crunchy is very simple and easy to set up.

We use Postresql mainly for our ‘Data Miners’.
DataMiners is our internal concept of processing low-level data into high-level data. For example, some assets require information from different smart contracts. In order to correctly map them to APIs and services (e.g. @dassets_bot) we manually create one DataMiner per Asset type that pulls data from clickhouse, processes it and saves it to Postgresql.
Each DataMiner is run separately and has its own protection against duplication, loss and status with logs.
Clickhouse HA
For clickhouse, we used Altinity's clickhouse-operator. It is also very convenient and easy to set up.
In addition, we split the index with account states per transaction (10tb) and the index of actual accounts and transactions without states per transaction (2tb), which will also increase query throughput and service stability.
Conclusion
We are constantly working on improving and supporting our services. With the transition to HA build, we believe that our services will become faster, more convenient and more stable.
P.S.
In the setup, we made a mindmap of the services, documetation of all settings for each service for easy-to-setup and configuration.